


Imagery in Agriculture
Imagery in Agriculture
March 16th, 2022: Now I Can See...Kinda

March 16th - 5th Edition of my Imagery in Ag weekly series
Visit my website www.easyobservations.com for more info about how we can work together.
Opening thoughts for the week
Another fun week as is normal. On a personal note, I actually got a mini-vacation this weekend with the wife and my neighbors to one of my favorite bands with get this...no kids! (as a note: I have a 4 and almost 3 yr old girl duo, and a 6mo old newborn) To say the least, I’m busy. Why I say this? I’m literally writing this the night before I’m sending it out so please forgive me for any grammar errors or crap like that. I’m still recovering, but I’m pushing through and mean well.
In saying that, it a gave me some good time to open the mind and relax. What does that have to do with this newsletter? One main thing: I’m starting to see this new revolution starting to happen in EO and with that how it’ll affect Agriculture. It’s not to say I know what that means or others have it figured out, but overall I just feel this confidence that something is finally changing in the realm of these two industries.
On one hand you have all the recent interest in EO data from war activities as I’ve mentioned. The other is the wildness of Ag in how it shifts due to worldwide changes from politics to natural disasters which are prevalent. Both of these groups have never had a better opportunity to work together and in a way that can actually help the world compared to just helping groups within the industries they work with.
It goes well beyond the fact that Agriculture literally has one of the largest impacts on the world and covers a majority of land that humans have touched. It is the oldest and largest industry as a whole for the most part. Why I say all of this is it just gives me the confidence in doing what I’m doing to try in some regard to help all sides in figuring out the battle between data and Ag. It’s not just EO I can tell you that, but EO does impact how others use other Ag data too. Something to think about in the old noggin. It’s not just about the data EO groups provide. That data influences how other data can be perceived.
As an example, think about it this way. An image from a satellite can tell how much general vegetation is growing on an area over time. That data is then used to provide a level of risk assumed towards crop insurance on how risky it is to farm a parcel of land. A group then showcases to a grower the risk level the amount they are willing to risk on their operation. This then provides the grower with an option on which decision he should take on what and how he grows something and manages its yield. This same data is used by commodity groups to also determine a general yield estimate based on imagery that is also used to determine acres planted and harvested giving them a depiction of what is the value overall.
Now, were all of those decisions based on just imagery? Hell no. It was used as a primer to get to the next step of an answer. It also takes other factors like weather, local cropping practices, management types, soil conditions, interaction with others i.e communication, legal, politics, and I can go on and on. Why I say this is on the surface it can seem imagery is the way the answer was produced, but it wasn’t. It’s come down to the perception in how it was and unfortunately some like to do this on both sides of EO and AG.
It’s nothing new, but it is something I wanted to showcase in the power of data and the misinterpretation as a marketing device as well. Use it for good and don’t use one dataset like EO imagery or other Ag dataset to say it’s the only data that shows the truth. The truth is ominous at best. Like how I needed time away from my awesome kids this weekend to relax, but also suffered when I came back as I also have crazy young wild kids and had too much fun while trying to relax at a concert. Hence, I didn’t really relax as it’s hard to, but worth it.
Highlight of the Week
Satellogic: While these guys have been around for awhile from what I’d call an extended R&D phase initially, they’ve really expanded recently into a main provider of data throughout the EO space. They are just getting into the Agriculture industry and while it likely won’t be their main “Go To” market they are hungry to say the least. To put it simply, they are a high resolution satellite imagery provider going after two approaches: Multi-Daily imagery availability at sub-meter access and repeatable worldwide background map creation.
What is their story? - Satellogic is trying to do something many have wanted for ever, get daily repeatable high resolution imagery data throughout the world that is accurate and of quality. I’ll say, they are getting there it seems. Also, recently becoming a public company on NASDAQ: SATL they are trying to push hard. They are doing better than some of the others so far to be honest on the open market.
Founded in 2010, Satellogic specializes in Earth Observation data collection and analytical imagery solutions. Satellogic designs, builds and operates its own fleet of Earth observation satellites to frequently collect affordable high-resolution imagery for decision-making in a broad range of industrial, environmental and government applications.
Now this all in general is great in many ways potentially, but what does it mean for Agriculture? On the surface, the biggest initial benefit will be their coverage, cost, and mainly the fact that you could just get a decent updated viewable image of a field. It may sound odd to some that are deep in analytics, but farmers almost always want to just see something more often that they are used too. Think of looking at Google Maps that is updated more often in a simple visual form. That is what many want just as a generic output. That and specialty crops is where I think they have the biggest opportunity.
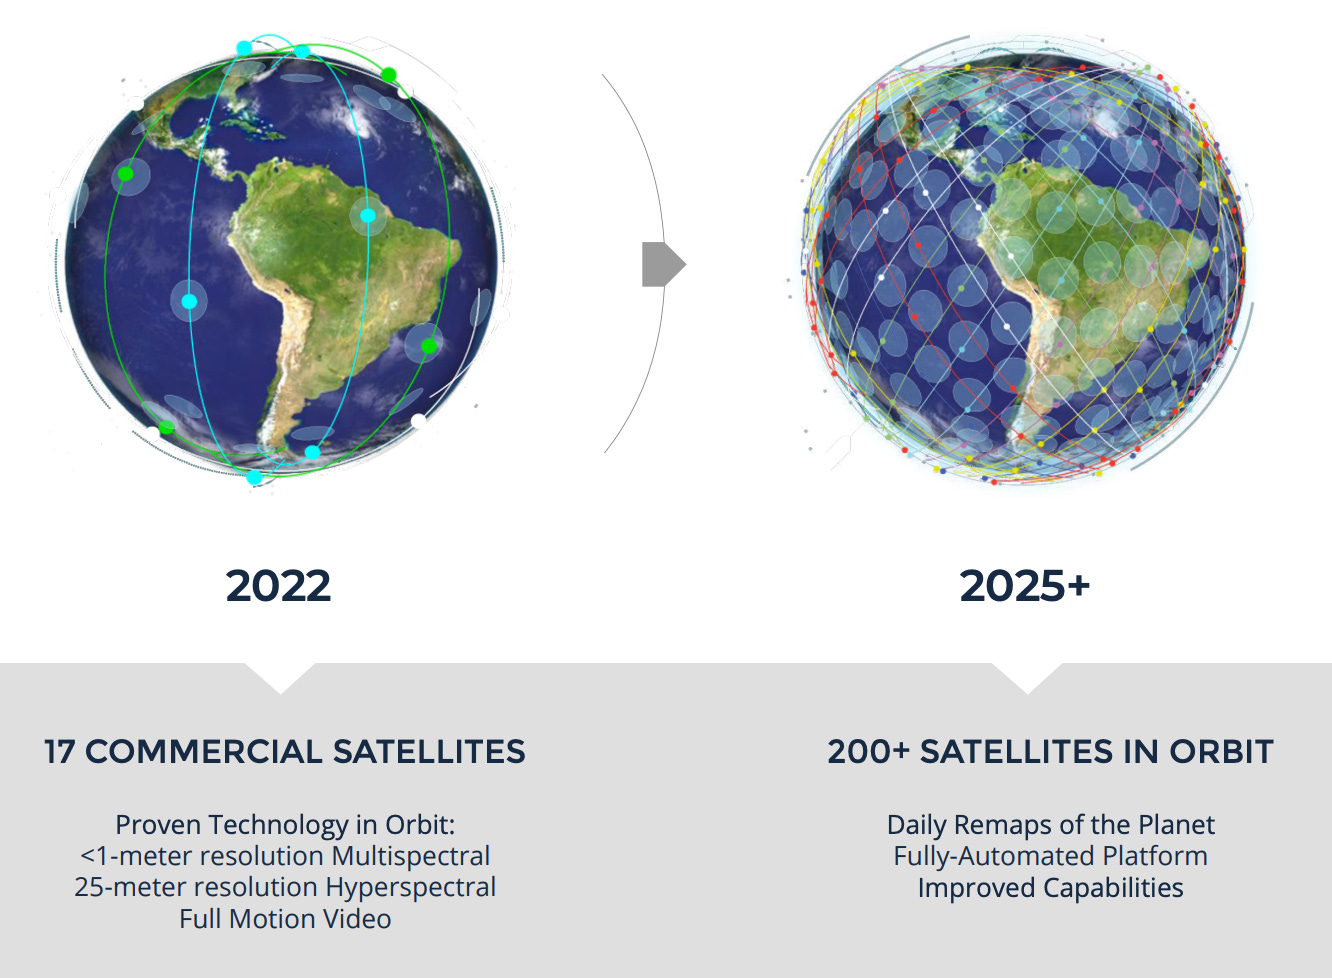
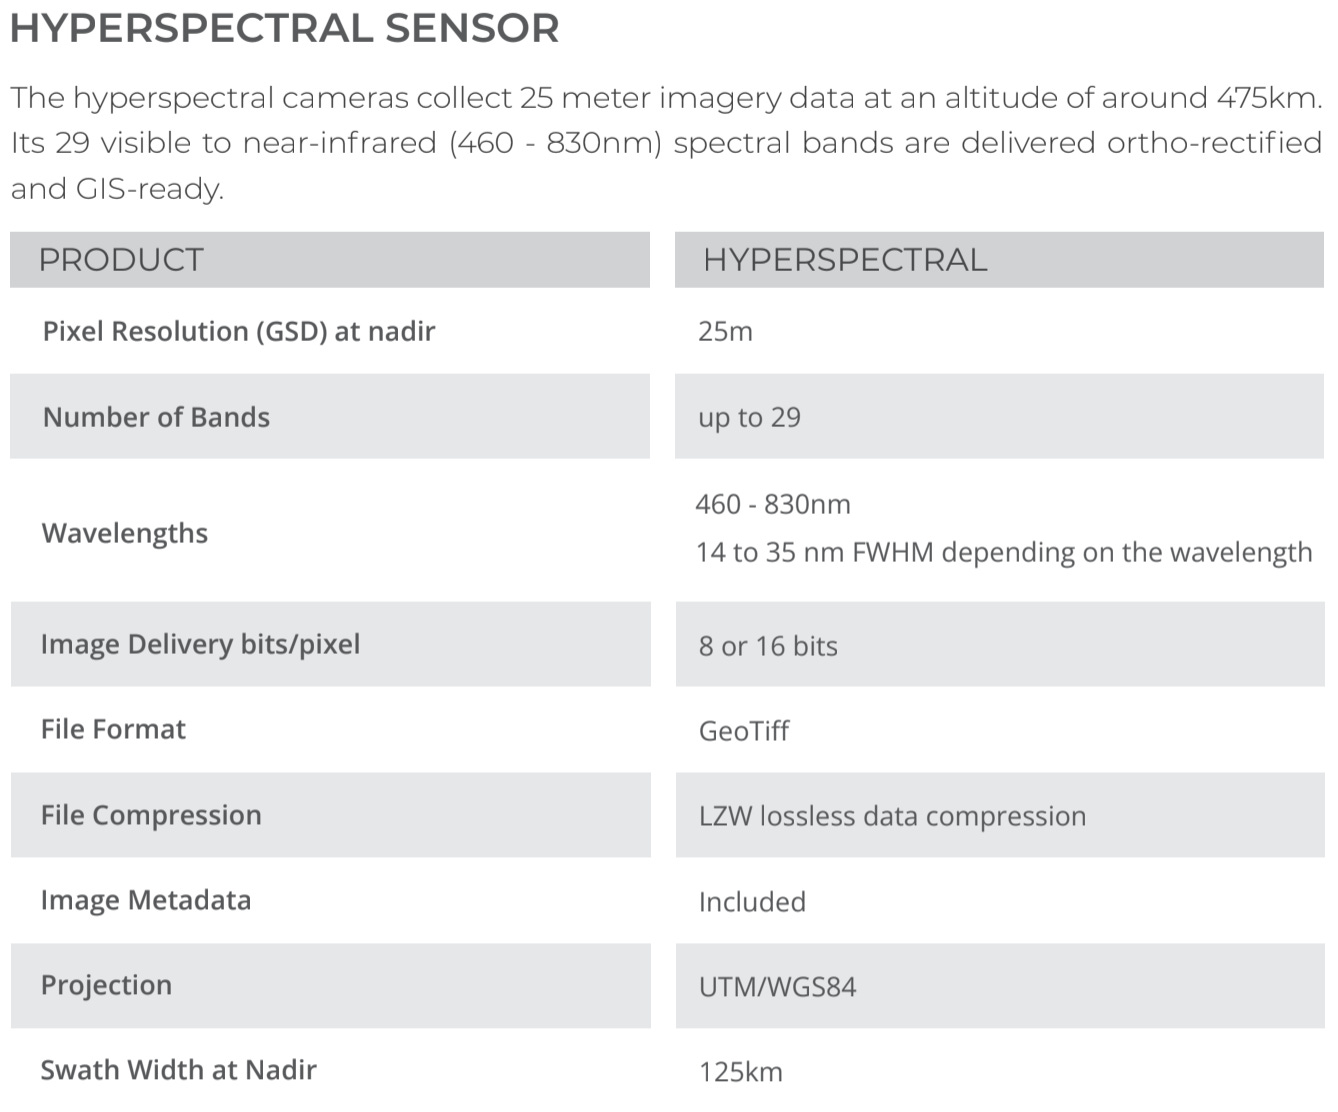
Since 2016, Satellogic has launched 17 NewSat satellites. All NewSat satellites have four-band imagers with a 1-meter (m) ground sample distance, and values in pixels are identical to values in meters. All NewSats have been launched into Sun-synchronous orbits of about 475 kilometers, with inclinations of about 97.5 degrees. The satellites have expected lifetimes of about 3 years.
Why they are different? - Similar to my showcase of last week yet different, they are going with a multi-type sensor approach with Multi and Hyper-spectral approach. This brings many many different opportunities for unique analytics and solutions in Ag and much beyond. Now I’ll say their Multispectral is a little week compared to others with only 4 bands. It still works, but the common thing now is going at least 8 band to include Red-Edge for instance which is a big one for Ag applications recently. It isn’t the end of the world and while I’m sure they’ll add these eventually, it’s something to think about depending on your needs for your analytics.

There are many possibilities with Hyper-spectral. I’m always semi-critical of it, not because of the data/sensor group per say, but what can actually be done with it. There is plenty of research done around Hyper-spectral and Agriculture, but the research isn’t great everywhere and not in a scalable approach. For instance, while one PHD has figured out how a certain wavelength showcases disease in spring wheat in say Canada, that same algorithm may not work with say winter wheat in Kansas. There are so many other effects with Hyper-spectral sensing we just don’t have enough research I’d say yet. Of course this is pretty much due to not having enough of it at good enough resolution at a decent price point. The data in itself provides different challenges too in how it is showcased and applied within common platforms. It’s getting there and the more data the better...as long as you can get it.
Now it seems they are trying to bring down the price point as well which is such a huge part in how groups in Ag use it. While I don’t have specifics on exactly how this would work for each type of situation, this graph from a presentation I have shows they are trying. This has always been a limiting factor for Ag especially with high resolution capabilities. If they can apply this correctly to Ag companies they have a real chance of making a dent. I’ve always thought that the first high resolution satellite company that can scale in Ag will win big. The problem has always been the want by these EO groups to even try. Maxar, Airbus, etc... have not really pushed hard with high-res in Ag and for good reason as it just was too costly and compared to what they could get from governments and large corps, why bother. Maybe Satellogic can break through and if they think they shouldn’t, they definitely should push harder. It’s a big opportunity!

What can they do now? - So, it seems they can do plenty as it would seem and that is compared to “not a lot” very recently. Also, being public they are in another world of opinion too which is good and bad naturally in the wild world of EO these days. They do have some heavy hitters in the investment side though with people like Steve Mnuchin (who invested 150m) and General Joseph Dunford Jr. (Former chairman of the US Joint Chief of Staff) on the board of directors. Overall, they can provide data and their data can provide insights.
Satellogic can provide their services via APIs “as-is-tradition” and can get you that data through many methods so there seems to be little reason they can’t help you if you are searching for high resolution in Ag applications and don’t want to deal with certain properties of Aerial or Drone groups. While they won’t be quite as good as those, it will be plenty to do some big things in Ag that are wanted like counting trees, seeing irrigation/machinery issues, compaction problems, planting skips, and other more precise scouting needs. Something to think about.

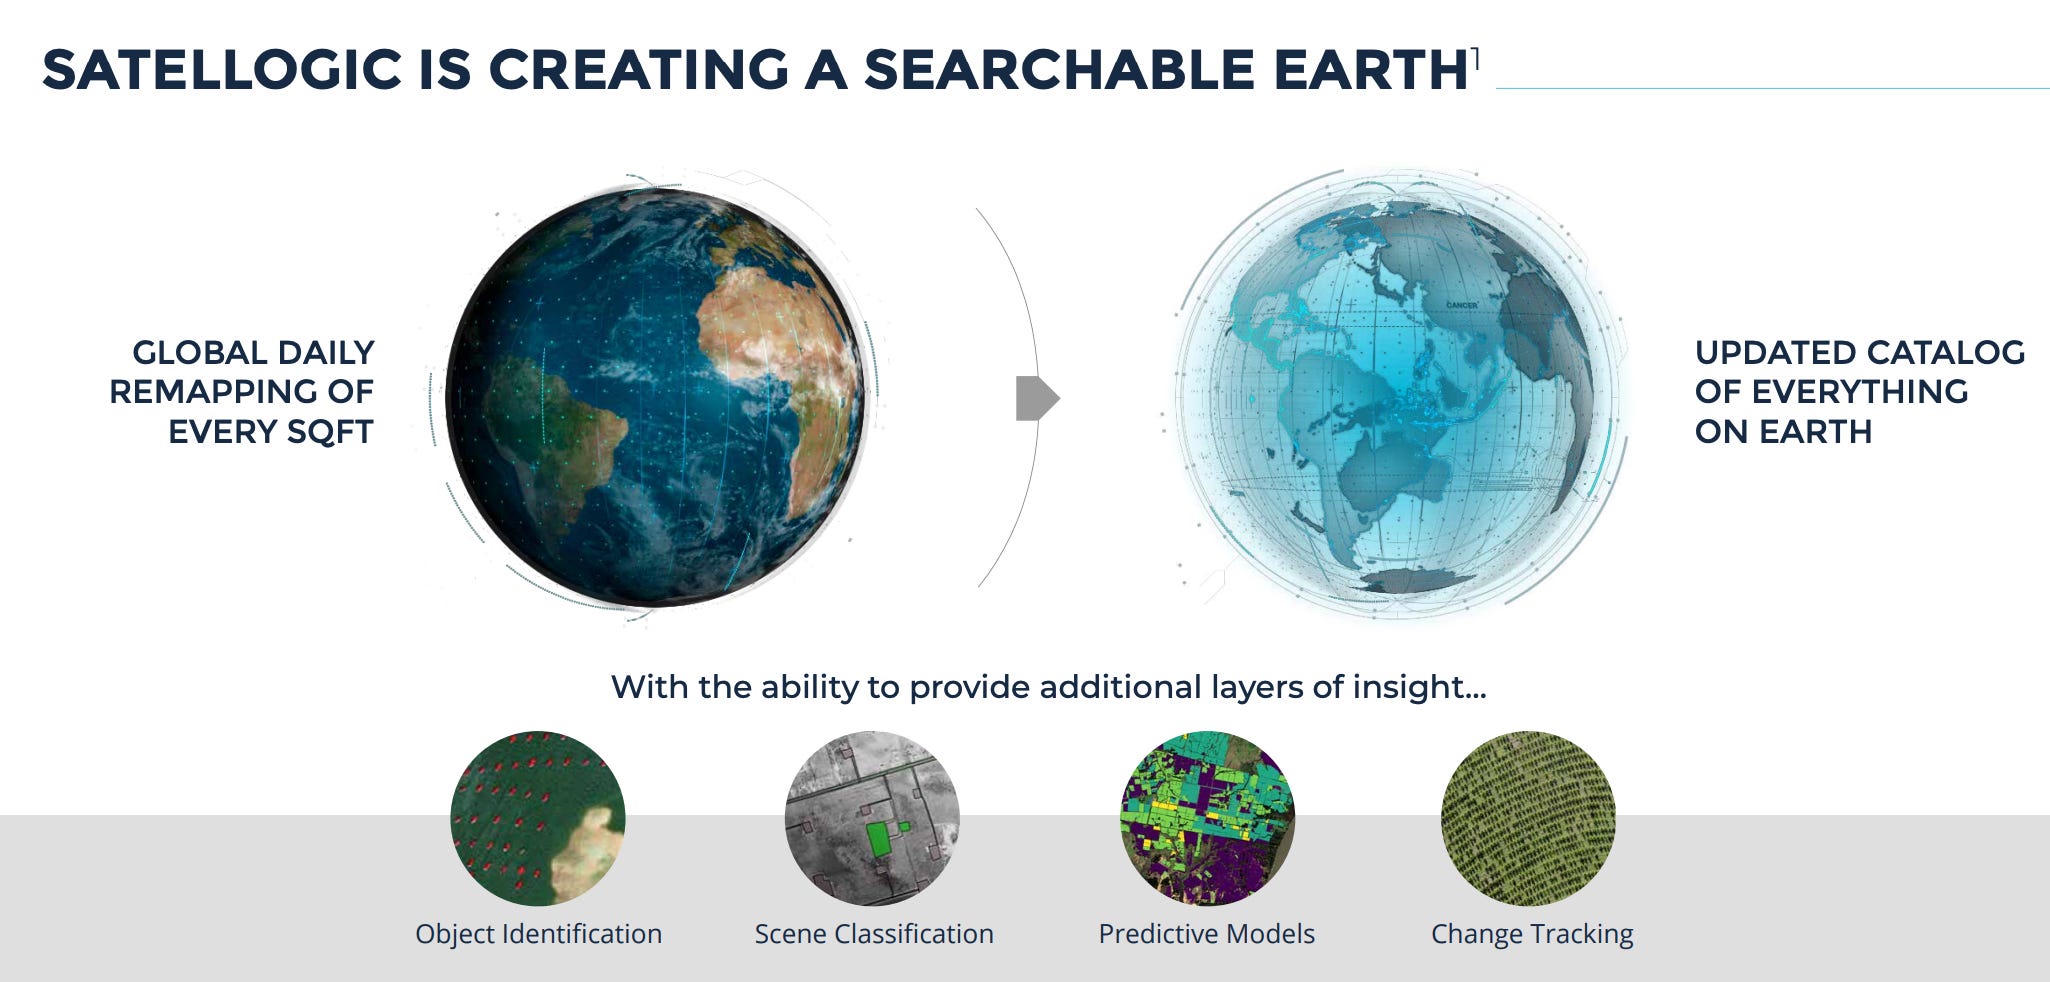
What’s the 411? - As you can see below, they are going after Ag (which does include Forestry to an extent) and it’s something they can it seems easily help with. While they have a lot of promising tech and future goals, they also have much more to prove too.

They are still trying to grab that big elusive Ag contract naturally and haven’t grabbed it yet from my current understanding. While it isn’t easy to get something like that, I’m not sure they need it either if they think about it correctly. Another issue though is their general lack of archived data in Ag areas that are also consistent with their newer satellites. The older ones from what I’ve gathered were more “test” satellites and ones that have general limitations. Nothing bad about that, but they are definitely in a building phase.

If they can build to the extent the pic above shows they have some real promise to be the sort of “Airbus, MAXAR” killer in certain industries, Ag being one of them. To be honest, no “high resolution” satellite group has done much in Ag anyway beyond test cases and certain projects. They could easily become the group to go to for this unless Planet and their Skysats can get in the way as well. It’ll be important for Ag groups and for Satellogic themselves to understand this as an open door, but one that is also very delicate.
The real value in how high resolution satellite data works in Ag in much different than say how Sentinel works now, Planet has worked-ish with their Doves, or as I talked last week groups like EarthDaily are approaching it. In some way, they could be smart to partner with another EO group (not the same type) that also has other satellites in space (or plan to) so as to create added options to certain problems through another method. Sure, sounds dumb maybe but I’m not the only one thinking that a lot of newer EO groups will likely be forced to merge or buy others anyway eventually. Time will tell.
All in all, Satellogic is on the up and up and seem to be a player with not only good tech and backing, but one that seems to also be delivering on its promises. They have much more to prove in the EO space and especially AG, but they are worth a look at and likely will have a large impact in some realm within Ag.
Quick takes
Frustration gone wild - Analyzing an entire satellite scene as NDVI
I can’t really call it hype so I’m going with more of a frustration. I can’t tell you how common it is in Ag and beyond in using NDVI to showcase the entire satellite scene automatically. Think of seeing 5 patterns across 100 sq/mi. For one, it looks like crap. Sure, looking from a distance it looks okay and shows variability, but that doesn’t help much. The real value is showing how detailed and precise the values change within a specific area or usually a field.
The problem is that so many Ag Analytic groups use some sort of automated analytical approach to this and just say, “Here is your field in NDVI.” Well, if you do that I can tell you it provides no value in Ag. In order to do it correctly, you need to show the differences better visually. If you are trying to put a 16 shade color scheme to an entire Sentinel scene on the thousands of different changes within an area you are going to have a bad time. Stop doing that. Then again, if you do that it shows to me you have no idea what you are doing in the landscape of EO in AG as well.
What I see so often are companies that push NDVI or some other indices and while there might be many different variations between the values (say -1 to 1) they only show it in 3-5 patterns using well 3-5 colors. Most times you just get a blob of colors depicting most of the field when in reality there is a ton of variations for many different reasons. So in being lazy all you do is show the end user that there isn’t much value.
Changing and showing the differences via multiple and editable color schemes to match the various indices is crucial showcasing the value to the actual product which is imagery data in general. This doesn’t apply as much to aerial or drone data as it is concentrated to a singular field usually, but those groups can do it as well.
In the end, just be better at showcasing how EO is presented instead of show a shitty canned NDVI type map that is based on just zooming into or clipping an NDVI that was done on an entire satellite scene or other EO image at a large scale.
I like it - Pixel by Pixel shadow and cloud detection
It is becoming more and more common, but trust me, wasn’t done for awhile if at all for many years. While not all groups do this now and it’s different for every application, trying to showcase what data is good and bad in Ag has been complicated for some time. The issue lies naturally in EO data commonly having issues with clouds and shadows. I’ll be honest, it’s been a huge challenge in Ag and one way the main reason at my families company we showed entire satellite scenes as a preview so people could see what they should and shouldn’t analyze as say NDVI.
Recently though, there have been newer tools that allow groups to disseminate better between the percentage of clouds/shadows from a satellite scene. It’s in general always been available as a whole from each scene as a percentage, but that doesn’t do any good for an individual AOI such as an individual field boundary. What was done a lot was recently and still is for some is showing the scene percentage of an entire scene (say 30% cloudy) and still analyzing it as an NDVI (see my frustrations above if you haven’t) then blobbing out the cloud or shadow yet still showing it to the user. This sucks as a UI/UX design.
Now for a bit, this was the easiest thing to do to help people know the risk of a potential cloud/shadow issue other than doing what we did before and still is a thing in showing the entire scene tile. It’s a give a take and also takes a different UI/UX thought process. Regardless, it hasn’t been perfect. Something that has been more and more prevalent is the ability to filter this by the pixel itself from the data source.
If a group filters the cloud/shadow value properly by the individual pixel and says it doesn’t want to show any analysis within a field that has a cloud/shadow even as a preview then that group has done a good thing. It is the first step in better product and better UI/UX experience in showing the real value of imagery EO data.
Many in Ag, such as growers, are too tough to educate on these types of things and if you can’t do it automatically you end up lessening the efforts in expanding the actual use of the end product around imagery. This is an issue with grower trusted advisors and many similar groups in Ag. EO/Ag groups need to do a better job instead of just providing what the GIF below showcases. The tools exist and while they are not perfect, they are getting better.

Closing thoughts for the week
It seems every time I start to write a lot about this particular grouping of industries I start to find hope and frustration all at the same time. Maybe it becomes a general theme for me. In any realm, I hope you can see the nuance in what I’m providing as a whole. It is not to praise one side or another, but really dive into the reality, opportunity, and issues within the combination of EO and AG.
I can’t define it perfectly other than they are married at this point. As someone who is married and as I’m sure many of my readers are, it isn’t always perfect. In saying that, it can also be wonderful and so fulfilling. It takes hard work and being open to new ideas. Just like a marriage it takes compromise and work with hope and understanding. This is what I’m trying to do more or less, be a sort of psychiatrist or counselor to these two industries. I can’t solve all of its problems and won’t, that is not the idea. It’s showcasing a path to a way to make these two great industries work together in a fun and valuable way. I’ll do my best and hopefully you can follow me into this adventure.

Thanks for reading Easy Observations! Subscribe for free to receive new posts and support my work.